
LCwHostLtd
-
Posts
9 -
Joined
-
Last visited
LCwHostLtd's Achievements
")


-
In this tutorial, we’re going to be using PuTTY to connect to your managed VPS, Cloud or dedicated server via SSH. For Windows users without an SSH client, we recommend you download PuTTY or enable OpenSSH. Requirements for using SSH to login to your VPS or Dedicated Server There are a few requirements for using SSH with your VPS or Dedicated Server. These include making sure that your account has been granted SSH access and that your IP address has been added to the firewall. Both of these requirements can be fulfilled through the WHM interface. The following articles will help you meet these prerequisites: Configure SSH access Whitelist your IP address in your server firewall Windows users, install an SSH Client or OpenSSH Terminal on Linux/macOS/BSD This applies to Windows users with OpenSSH: Open the Start menu,select Powershell, and then Run as Administrator. If you are trying to directly connect from a Linux or Mac terminal via SSH, please note the format of the command would need to be in this format:18If you are trying to directly connect from a Linux or Mac terminal via SSH, please note the format of the command would need to be in this format: [Bob ~]$ ssh username@example.com -p 22 If you do not specify the full username such as username@example, the server would instead try to login as your local user, in this case Bob@example.com, and because that user doesn’t exist on the server you’d get a login error.
-
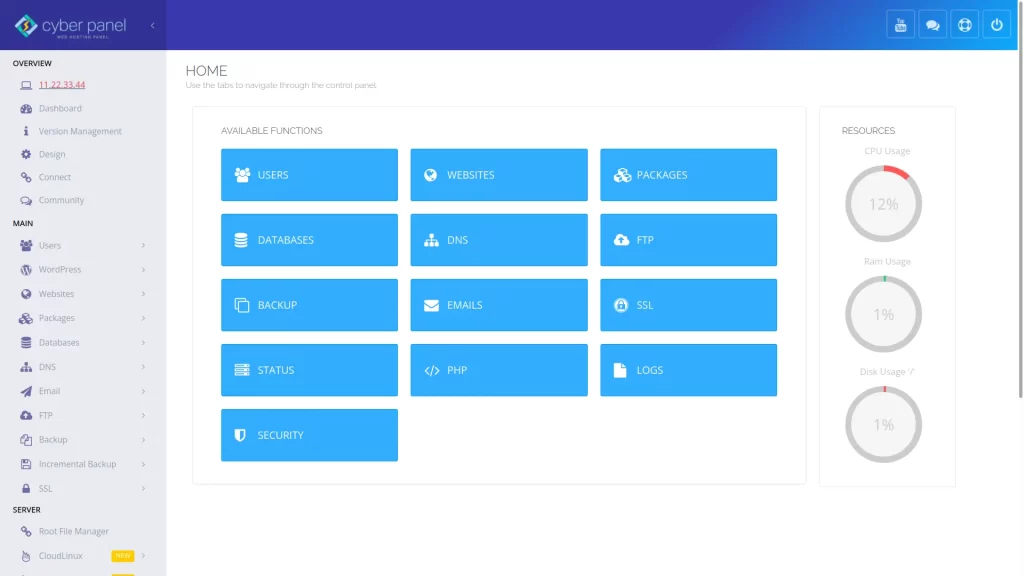
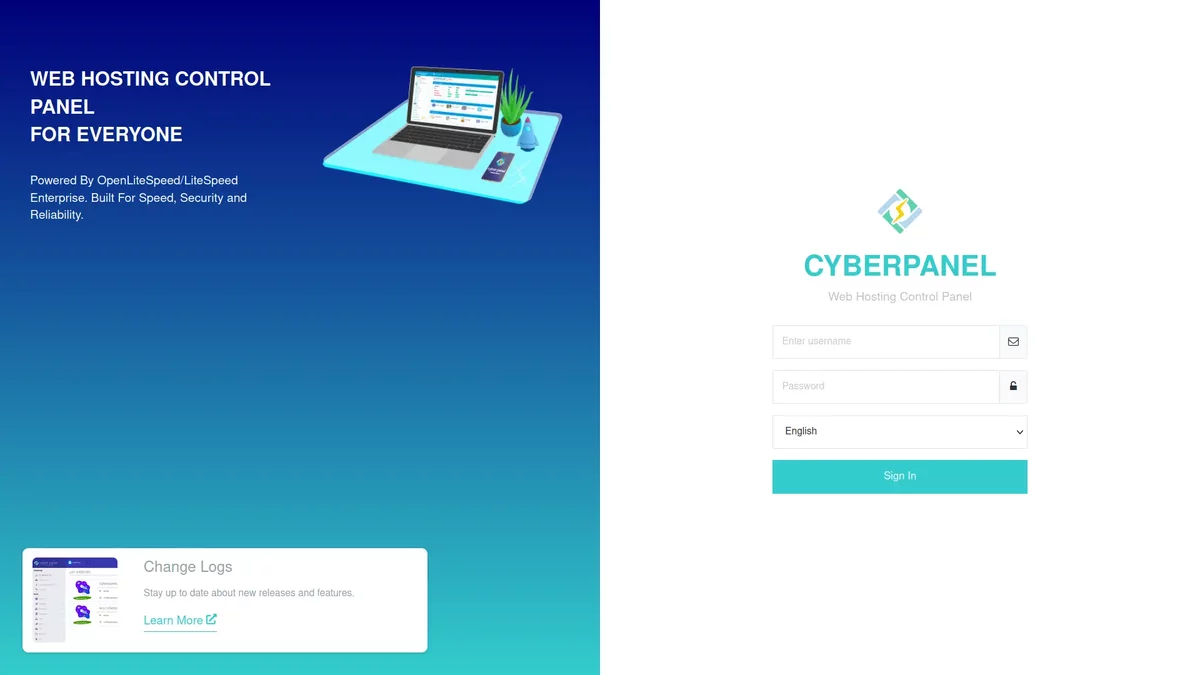
Follow these steps to install CyberPanel on Ubuntu or Enterprise-based distros. Log into SSH. Run the CyberPanel installation script: sh <(curl https://cyberpanel.net/install.sh || wget -O - https://cyberpanel.net/install.sh) Type “1” and Enter to confirm installation. Choose “1” to install CyberPanel with OpenLiteSpeed. Remember, you’ll need a LiteSpeed Enterprise license for the Enterprise version. Choose “Y” to install “full service for CyberPanel” – PowerDNS server, Postfix mail transfer agent (MTA), and Pure-FTPd server. Choose “N” to skip remote MySQL setup and continue with local MySQL server setup. Choose the latest MySQL version unless you’ll be importing a database that requires a specific, older version. Choose “s” to set an admin password. Type and confirm your admin password. Choose whether to install Memcached and its PHP extension. You can always install this later if you don’t need it right now. Decide whether to install Redis and its PHP extension. Again, you can install this post-installation. Choose whether to install WatchDog, currently in beta, which automatically reboots downed systems with software errors. If you’re on a production system and unsure about this, we recommend denying this. The installation may take up to ten minutes. Afterwards, save the auto-generated LiteSpeed WebAdmin console password and Rainloop Webmail admin password in a password manager. The admin username for each login is “admin.” Ubuntu users must choose “N” when asked to reboot the system. CentOS, AlmaLinux, and other Enterprise-based distro users may select “Y” and continue to the next section. (Ubuntu users) Due to Ubuntu-specific issues, you’ll need to stop and disable Firewalld: systemctl stop firewalld && systemctl disable firewalld Restart the system: reboot Contact CyberPanel developers directly regarding Ubuntu firewall issues. Log into CyberPanel The URL to access your CyberPanel installation in the web browser is: https://your-server-hostname:8090 Username: admin Password: the same password you set during initial setup. The dashboard shows buttons for primary functions with system resource usage stats on the right. The top-right options grant quick access to various CyberPanel user communities. The sidebar on the left lists primary sections which expand to show additional options when clicked. Learning Your CyberPanel Installation Here are some ideas to help you get started: Configure automatic CyberPanel backups Create SSL certificates for the CyberPanel panel domain name Create regular users to manage websites Create a WordPress site in just a few clicks The terminal command below resets your CyberPanel admin password. A space is added at the beginning to prevent the password from showing in bash history. Furthermore, we recommend using a simple password to ensure the process works. After you login, change the admin password to a stronger one. adminPass password! Log into OpenLiteSpeed WebAdmin Console Manage LiteSpeed web server settings from the web interface at: https://your-server-hostname:7080 The username is “admin.” To reset your LiteSpeed console password, open a terminal session and run the following command: sudo /usr/local/lsws/admin/misc/admpass.sh Press Enter to reset the default user – “[admin].” Enter and confirm the new password. Log into Rainloop WebMail Access the Rainloop webmail web interface at: https://your-server-hostname:8090/snappymail/?admin The username is “admin.” To reset the Rainloop admin password, edit the configuration file: nano /usr/local/lscp/cyberpanel/rainloop/data/_data_/_default_/configs/application.ini Add the following: [security] admin_password = "12345" Save the settings. Login and change the password immediately. During testing, we were unable to reset the Rainloop admin password in Ubuntu. Further research showed that many users have similar issues. Contact CyberPanel developers directly for additional assistance. Don’t forget to regularly check for server updates. Check out our Support Center to learn more about managing your cloud server. With our Cloud VPS plans, you can deploy a lightning-fast, reliable cloud platform with built-in redundancy – ensuring the availability of your environment! This entry was posted in CyberPanel.

-
 LCwHostLtd changed their profile photo
 -
Introduction Plesk is a commercial web hosting data center automation software developed for commercial hosting service providers. Plesk was designed to be compatible with Linux and Windows hosting services, to install and manage web hosting systems and applications on a single server. The control panel is designed to simplify the management and administration of the websites by automating various tasks on a single server. Plesk's control panel allows a server administrator to set up new websites, reseller accounts, e-mail accounts, and DNS entries through a web-based interface. The administrator can create client and site templates, which predetermine resource-allocation parameters for the domains and/or clients. More information can be found on the official web page: https://www.plesk.com/ Plesk template In LCwHost LTD you are able to install Plesk template for Linux and Windows hosting KVM VPS really easy and fast, only with few mouse clicks: 1. Login to the Client Area; 2. Select at the top of the menu the "Services" > "VPS" tab; 3. Press the "Manage" button at the service table; 4. Press the "Install OS" button; 5. Choose an operating system, agree with warning and press "Continue"; 6. Wait for 5-10 minutes and refresh the VPS management page. 1. Plesk Initial Set Up Plesk uses 8443 port, so to connect to control panel for the first time on your internet browser enter: http://ip_of_your_server:8443 For the first log-in use your "root" credentials, that are provided in your service management page "Login Details" tab. Note. You can also use the username "Administrator" for Windows with a password provided in the Clients Area site. After log-in, you will be displayed with some fields to enter the contact email address, password and license key: After the initial setup is complete, on your first login, you will be present with a window to add your first and main domain in order to unlock the full functionality of panel: 2. Adding The New User Account To Plesk On the left menu choose "Users" and then press the button "Create User Account". Fill the form and create your new user: 3. Adding Email Account On the left side menu, choose "Mail" and then press "Create Email Address" button on the top. 4. Adding New FTP User On the left side menu, choose "Websites & Domains", then choose "FTP Access" and then "Add an FTP account" button on the top. 5. Adding Database On the left side menu, choose "Databases", then "Add Database" button on the top. 6. Adding Additional Domain On the left side menu, choose "Website & Domains", then "Add Domain" button on the top. 7. Password Reset Plesk UI: On the left choose "My Profile" and fill "Password", "Confirm password" filed and save. Note. "*****" should be replaced with your actual new password. For more information about Plesk for you Linux or Windows hosting, contact our 24/7 customer support or check the documentation: https://docs.plesk.com/en-US/onyx/
-
This article explains how to check if your server is facing an attack and how to manage it. The steps below are the suggestions that you can use to check your server and see if it could be under some sort of attack. One of the first things you could do in case you feel the server/website and its tasks are running slowly is to simply check your server load, it could be done with the following commands: If you are not sure or you don't know, you can find out the number of processors using these commands: grep processor /proc/cpuinfo | wc -l nproc These commands will show just a number of your processors on the server. For example 1, 2, 4 and etc Now you can check the server load using the other commands: uptime cat /proc/loadavg The result of this command is very simple, but you could notice some anomalies here. An example of the uptime command output: The output of the command shows how long is your server is up, how many users are currently logged in, and the load average, which provides values of 1 minute, 5 minutes, and 15 minutes. Considering we have 1 processor, the load values seem normal and not out of the ordinary. However, if the load average would be something like 1.50, 2.23, 8.14, this could be identified as a potential issue. The 1.00 stands for 100% of CPU utilization. So if the values are 1.50, 2.23, 8.14, they could be read as follows: 1.50 meaning that the CPU is overloaded by 50% during the last 1 minute; 2.23 meaning that the CPU is overloaded by 123% during the last 5 minutes; 8.14 meaning that the CPU is overloaded by 714% during the last 15 minutes. While 50% or even 123% in this short time could be acceptable, the 3rd value should raise a concern. However, seeing the values decreasing could translate that the 'issue' is disappearing. While if the load values were 8.14, 2.23, 1.50 this could say that the load is just increasing right now. The load values could show a potential issue regarding the server being attacked. The server load can rise according to the requests/traffic your server receives, however it could not be related to attacks at all, so we should check further and the next step is network traffic. In a Linux environment, we could use netstat. This command could help to monitor the network and identifying possible issues. Here are a few general commands: The command shows the number of connections each IP has with the server. It helps to identify the IPs that are connecting to the server most often. A single IP could be accessing your server a few times. For example, if you host some online resources, it might be normal to receive multiple connections from the same IP, as some smaller companies or networks with a shared IP are accessing your online resource. So you should include these possibilities depending on your server. However, let's say that one IP has 100+ connections to your server, this might seem suspicious and you should recheck it. netstat -ntu|awk '{print $5}'|cut -d: -f1 -s|sort|uniq -c|sort -nk1 -r A few more netstat commands for general monitoring. This command shows all the active connections to the server: netstat -na This command shows all the specific traffic(in example port :80) by IPs : netstat -an | grep :80 | sort This command shows the number of connections by IP via TCP and UDP ports: netstat -anp |grep 'tcp\|udp' | awk '{print $5}' | cut -d: -f1 | sort | uniq -c | sort -n All these commands as well as other options that netstat provides can help you to identify if there is something incorrect on your server network. Now let's say you visited your website and noticed it runs slowly, you get 5xx errors. You then access the server and notice it's responding slower than usual - this could be a moment you can start checking your server load first. It could confirm something is wrong if the load is heavy. Then you could check the connections to your server and perhaps identify that a few IPs are connecting to the server hundreds of times. If these IPs are unknown, this could be considered as an attack against your server. The next phase should be mitigating the attacks. Here are a few methods on how to do that. If you noticed an unknown IP or a few that are just generating connections to your server and you want to stop that, you can block it using iptables, for example: iptables -A INPUT -s 111.11.1.1 -j DROP(or REJECT) service iptables save service iptables restart More information about how to use iptables in this tutorial. Another thing is if you stopped everything, but yet the server is slow, there could be many Apache processes stuck due to previous connection attempts, you may try to simply kill them all and then start the Apache freshly(this usually takes ups to a few minutes or quicker): killall -KILL httpd service httpd start Note. This article is a simple way to check and try to find out if your server is under attack when you have any suspicions. There are many other tools, methods, and procedures that you can use as well. This is just something to get you started.
-
We can easily manage Exim via command line. We can easily remove mailqueues, If any particular user sending large number of emails we can easily find that account and remove it. All sent mails is registered in directory /var/spool/exim/msglog and all records have their own ID number which is the same as message ID. In directory /var/spool/exim/input all records are marked after their ID with mark -H (header) and -D (content of message). For every sent message Exim creates 3 files. We wil be working with mentioned directories. 1. To get counted message in the queue: exim -bpc 2. Print a listing of the messages in the queue (time queued, size, message-id, sender, recipient): exim -bp 3. Print a summary of messages in the queue (count, volume, oldest, newest, domain, and totals): exim -bp | exiqsumm 4. Print what Exim is doing right now: exiwhat 5. Testing how e-mail address is pointed: exim -bt mail@domain.com 6. Run a pretend SMTP transaction from the command line, as if it were coming from the given IP address. This will display Exim's checks, ACLs, and filters as they are applied. The message will NOT actually be delivered: exim -bh XXX.XXX.XX.XX 7. Display all of Exim's configuration settings: exim -bP Searching the queue with exiqgrep Exim includes a utility that is quite nice for grepping through the queue, called exiqgrep. 1. Use -f to search the queue for messages from a specific sender: exiqgrep -f @domain 2. Use -r to search the queue for messages for a specific recipient/domain: exiqgrep -r @domain 3. Use -o to print messages older than the specified number of seconds. For example, messages older than 1 day: exiqgrep -o 86400 [...] 4. Use -y to print messages that are younger than the specified number of seconds. For example, messages less than an hour old: exiqgrep -y 3600 [...] 5. Use -s to match the size of a message with a regex. For example, 700-799 bytes: exiqgrep -s '^7..$' [...] Use -z to match only frozen messages, or -x to match only unfrozen messages. There are also a few flags that control the display of the output. 6. Use -i to print just the message-id as a result of one of the above two searches: exiqgrep -i [ -r | -f ] ... 7. Use -c to print a count of messages matching one of the above searches: exiqgrep -c ... 8. Print just the message-id of the entire queue: exiqgrep -i Managing the queue 1. Start a queue run exim -q -v 2. Start a queue run for just local deliveries: exim -ql -v 3. Remove a message from the queue: exim -Mrm <message-id> [ <message-id> ... ] 4. Freeze a message: exim -Mf <message-id> [ <message-id> ... ] 5. Throw a message: exim -Mt <message-id> [ <message-id> ... ] 6. Deliver a message, whether it's frozen or not, whether the retry time has been reached or not: exim -M <message-id> [ <message-id> ... ] 7. Deliver a message, but only if the retry time has been reached: exim -Mc <message-id> [ <message-id> ... ] 8. Force a message to fail and bounce as "cancelled by administrator": exim -Mg <message-id> [ <message-id> ... ] 9. Remove all frozen messages: exiqgrep -z -i | xargs exim -Mrm 10. Remove all messages older than five days (86400 * 5 = 432000 seconds): exiqgrep -o 432000 -i | xargs exim -Mrm 11. Freeze all queued mail from a given sender: exiqgrep -i -f luser@example.tld | xargs exim -Mf 12. View a message's headers: exim -Mvh <message-id> 13. View a message's body: exim -Mvb <message-id> 14. View a message's logs: exim -Mvl <message-id> Digging Into Exim Mail Logs With Exigrep One single mail transaction will span multiple lines in the file, and not every line will have the search string you are looking for. The exigrep command works around this problem by finding your search string in transactions, and then helpfully gathering every log entry into separate, complete transactions. 1. Search for messages sent from a particular IP address: exigrep '<= .* \[12.34.56.78\] ' /path/to/exim_log 2. search for messages sent to a particular IP address: exigrep '=> .* \[12.34.56.78\] ' /path/to/exim_log This is how you search for outgoing messages with the “=>” symbol that are sent to “mail@domain.com”. The pipe to grep for the “<=” symbol will only match lines containing information on the sender, the From address, the sender’s IP address, the message size, the message ID, and the subject line if you have enabled logging the subject. 3. Generate and display Exim stats from a logfile: eximstats /path/to/exim_mainlog 4. Same as above, with less verbose output: eximstats -ne -nr -nt /path/to/exim_mainlog 5.To delete all queued messages containing a certain string in the body: grep -lr 'a certain string' /var/spool/exim/input/ | \sed -e 's/^.*\/\([a-zA-Z0-9-]*\)-[DH]$/\1/g' | xargs exim -Mrm -- http://www.exim.org/ -- http://www.exim.org/docs.html
-
This tutorial explains how to manually install DirectAdmin with a license on a Linux server from the command line(SSH). Requirements * DirectAdmin license * One of the following OS templates installed: CentOS 7, CentOS 8, Debian 8, Debian 9, Debian 10, Debian 11 Installation DirectAdmin installation is very simply you simply, here are the basic steps: Connect to your Linux server via SSH; Enter the following installation command: bash <(curl -Ss https://www.directadmin.com/setup.sh || wget -O - https://www.directadmin.com/setup.sh) Once the command is executed, a download will start, shortly after you will be prompted to enter your license key. Enter your DirectAdmin license key and proceed. That is it, once the installation is complete, DirectAdmin can be accessed at http://server.ip.address:2222. Important. Use the Admin username/password provided by the file: /usr/local/directadmin/scripts/setup.txt